- Halloween is around the corner, and some cities are very well primed to celebrate the holiday.
- Using data from the Census Bureau, we found the US metro areas with the most establishments in four Halloween-related industries per capita.
- Visit Business Insider’s homepage for more stories.
Halloween is around the corner, and some cities are well primed to celebrate the holiday.
The Census Bureau’s County Business Patterns program releases annual estimates of the number of business establishments in a wide variety of industries in metropolitan areas across the US.
A recent Census release highlighting various Halloween-related statistics pointed out a handful of industries particularly salient to the trick-or-treat season: Chocolate candy manufacturing, non-chocolate candy manufacturing, candy and nut stores, and formal wear and costume rental.
Using data from the 2016 County Business Patterns release, the most recent year for which data was available, we found how many establishments from those four “Halloween industries” were in each metro area in the country, adjusted by the metro area’s 2016 population.
Here are the 20 metro areas with the most Halloween businesses per capita, according to the Census data:
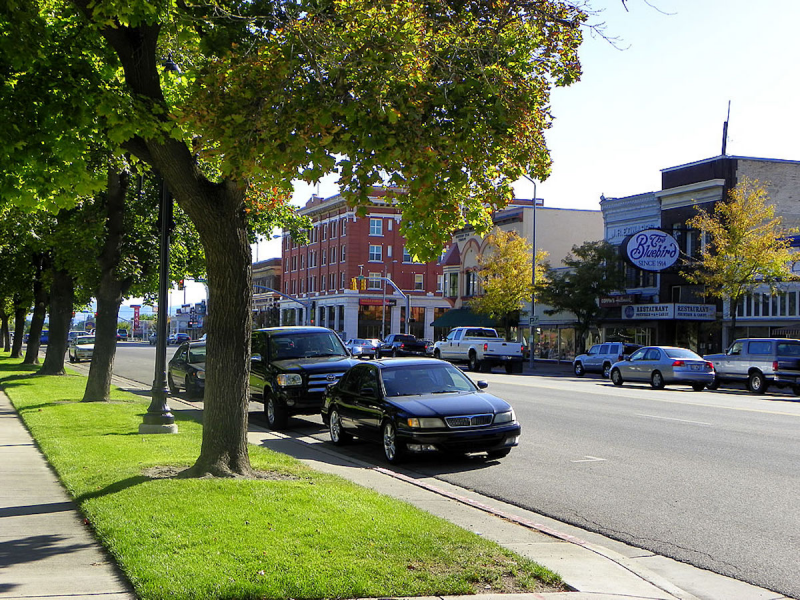
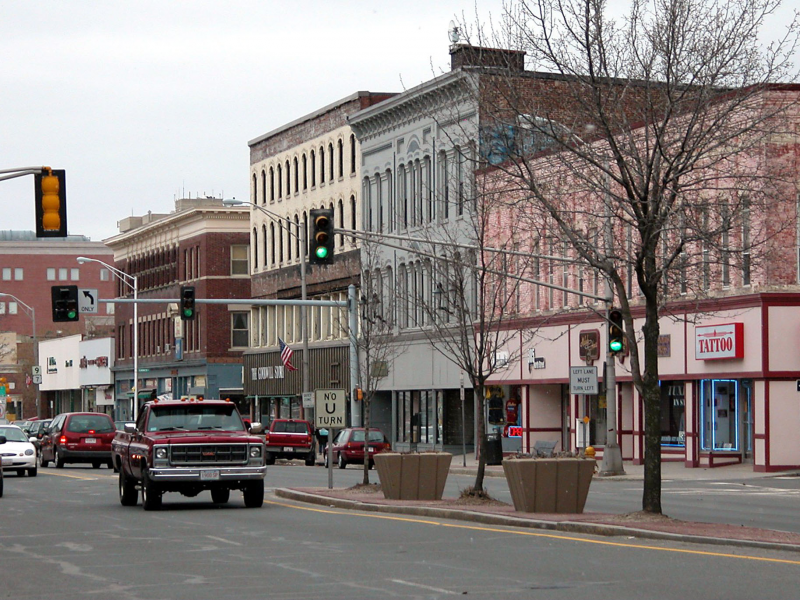
20. Elmira, New York, had 3.5 Halloween businesses per 100,000 people.

2016 metro area population: 85,676
19. Oshkosh-Neenah, Wisconsin, had 3.5 Halloween businesses per 100,000 people.

2016 metro area population: 169,637
18. Watertown-Fort Drum, New York, had 3.5 Halloween businesses per 100,000 people.

2016 metro area population: 113,015
17. Kankakee, Illinois, had 3.6 Halloween businesses per 100,000 people.
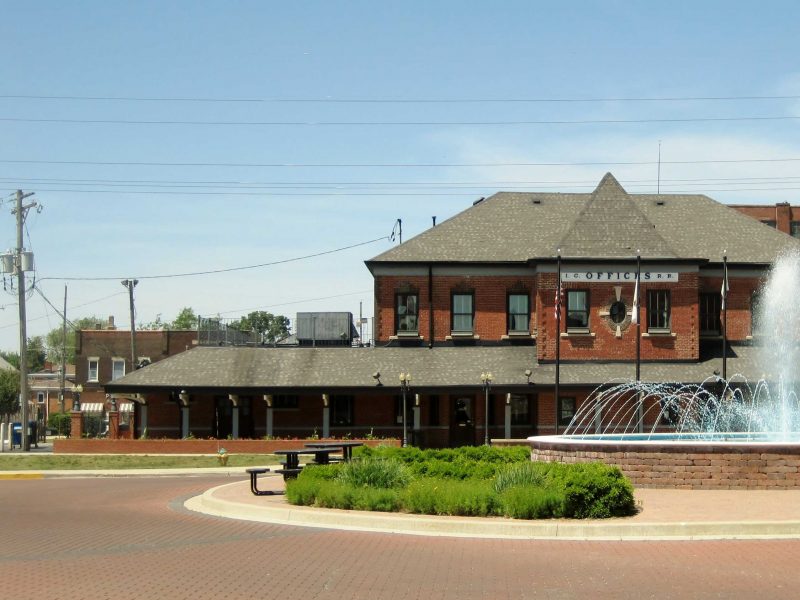
2016 metro area population: 111,074
16. Logan, Utah-Idaho, had 3.7 Halloween businesses per 100,000 people.
2016 metro area population: 135,685
15. Bend-Redmond, Oregon, had 3.9 Halloween businesses per 100,000 people.

2016 metro area population: 180,649
14. San Luis Obispo-Paso Robles-Arroyo Grande, California, had 3.9 Halloween businesses per 100,000 people.

2016 metro area population: 281,958
13. Gettysburg, Pennsylvania, had 3.9 Halloween businesses per 100,000 people.

2016 metro area population: 101,812
12. Pittsfield, Massachusetts, had 3.9 Halloween businesses per 100,000 people.
2016 metro area population: 127,106
11. Scranton-Wilkes Barre-Hazleton, Pennsylvania, had 4.0 Halloween businesses per 100,000 people.
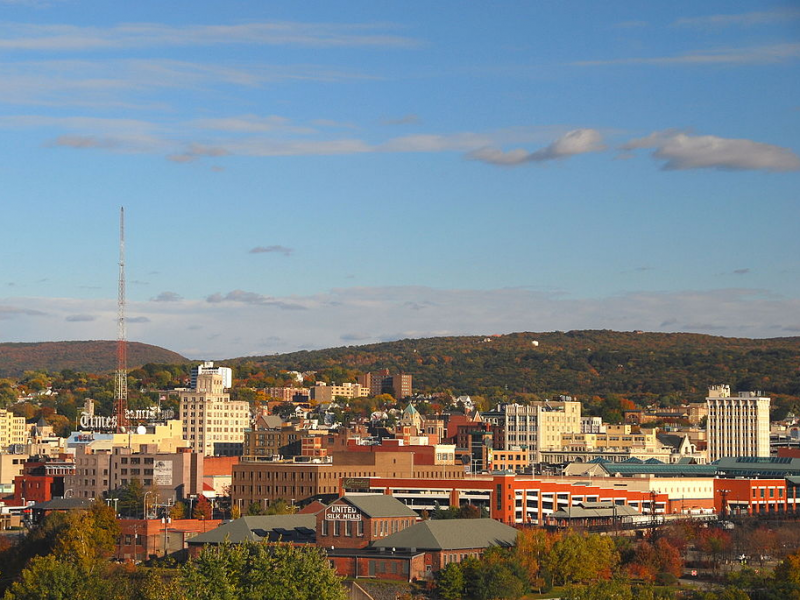
2016 metro area population: 555,633
10. Wenatchee, Washington, had 4.3 Halloween businesses per 100,000 people.

2016 metro area population: 117,403
9. Atlantic City-Hammonton, New Jersey, had 4.5 Halloween businesses per 100,000 people.

2016 metro area population: 267,813
8. Santa Fe, New Mexico, had 4.7 Halloween businesses per 100,000 people.

2016 metro area population: 148,888
7. Glens Falls, New York, had 4.8 Halloween businesses per 100,000 people.

2016 metro area population: 126,195
6. Kahului-Wailuku-Lahaina, Hawaii, had 4.8 Halloween businesses per 100,000 people.

2016 metro area population: 165,712
5. Altoona, Pennsylvania, had 4.9 Halloween businesses per 100,000 people.

2016 metro area population: 123,680
4. Carson City, Nevada, had 5.5 Halloween businesses per 100,000 people.
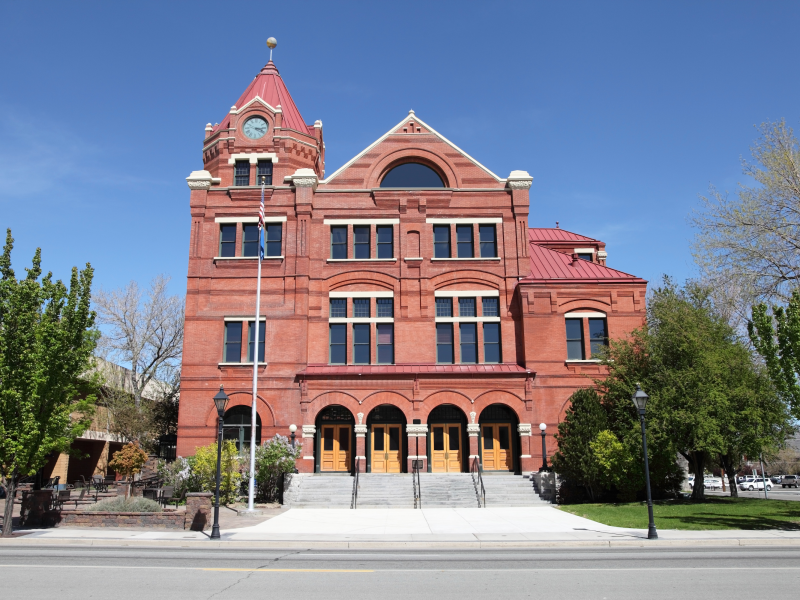
2016 metro area population: 54,147
3. Missoula, Montana, had 6.0 Halloween businesses per 100,000 people.

2016 metro area population: 116,352
2. Salisbury, Maryland-Delaware, had 6.8 Halloween businesses per 100,000 people.

2016 metro area population: 398,682
1. Ocean City, New Jersey, had 26.7 Halloween businesses per 100,000 people.

2016 metro area population: 93,679