
The results are in, and Donald Trump is settling in as the US president-elect.
Over 60 million people cast their ballots for Democratic nominee Hillary Clinton, while 59.8 million voted for Trump. But how did these votes split on demographic and party lines?
Exit polls, put together by Edison Research for the National Election Pool, surveyed more than 24,000 voters to find out.
Here are seven charts breaking down its key demographics, showing who propelled Trump to victory:
More women voted for Clinton, as expected, but Trump still got 42% of female votes.
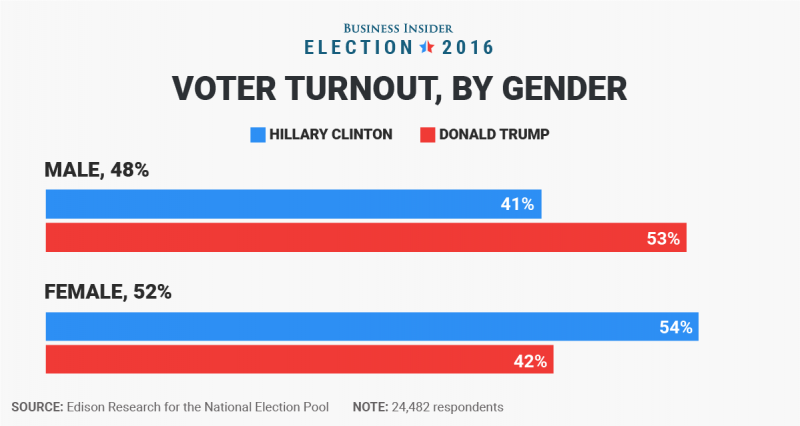
Foto: source Skye Gould/Business Insider
More young people voted for Clinton, but there weren’t as many of them as a bloc to make up the difference for the people over 40 who, as a majority, voted for Trump.
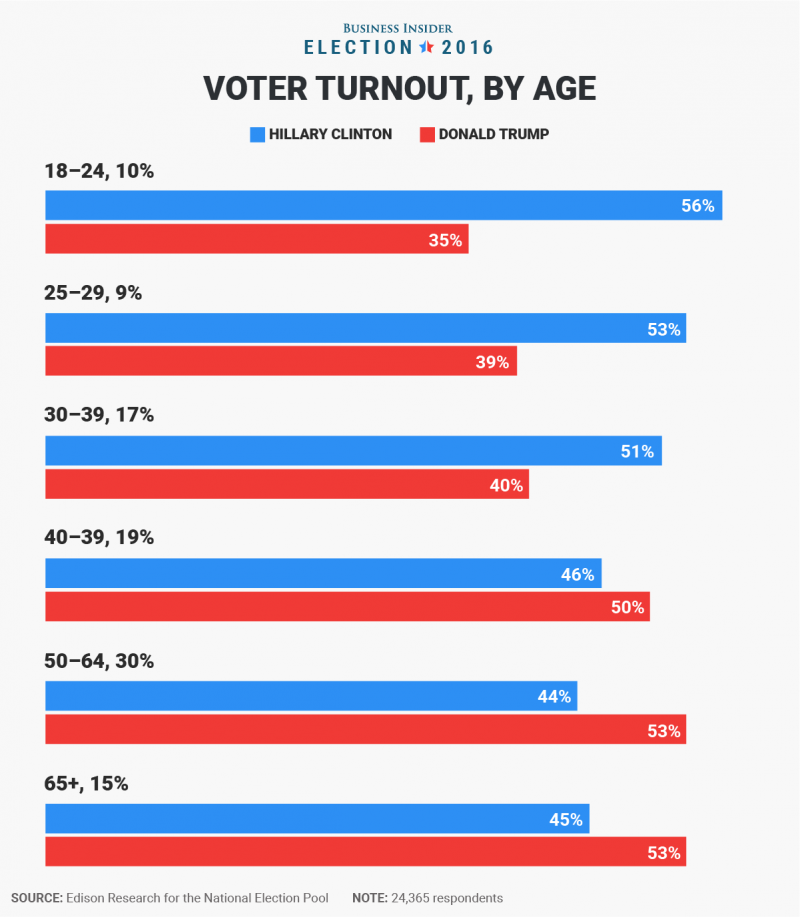
Foto: source Skye Gould/Business Insider
The racial divide between Democratic and Republican votes is clear.
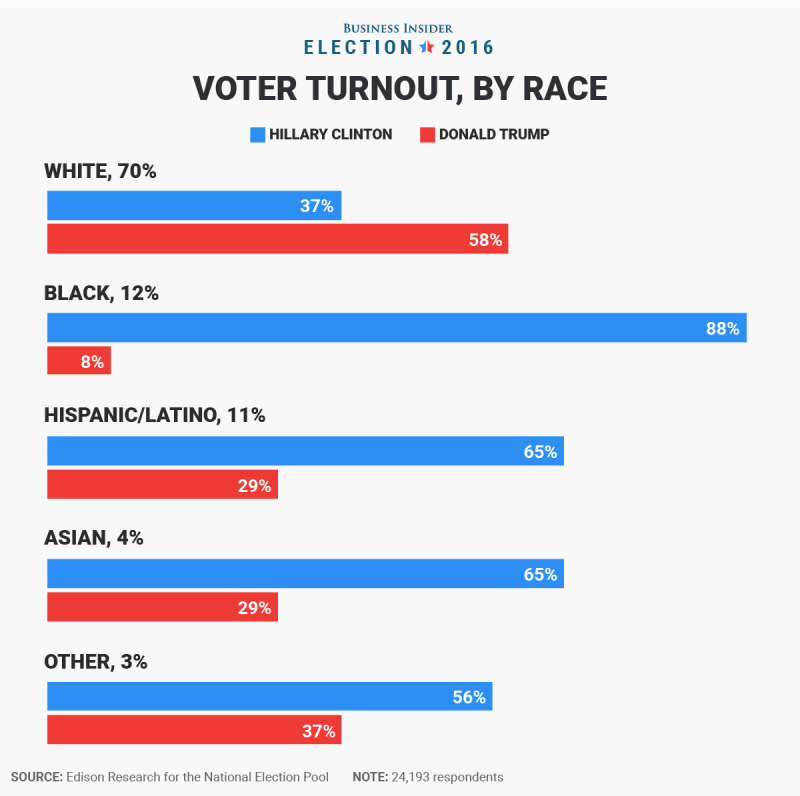
Foto: source Skye Gould/Business Insider
Clinton only secured a majority of votes for people with 2015 family incomes under $50,000 — which made up 36% of the voters in the exit polls.

Foto: source Skye Gould/Business Insider
Clinton edged out Trump with 52% of moderate voters. More people identified as conservative-leaning than liberal, though. The stark divide between the left and the right is evident here.
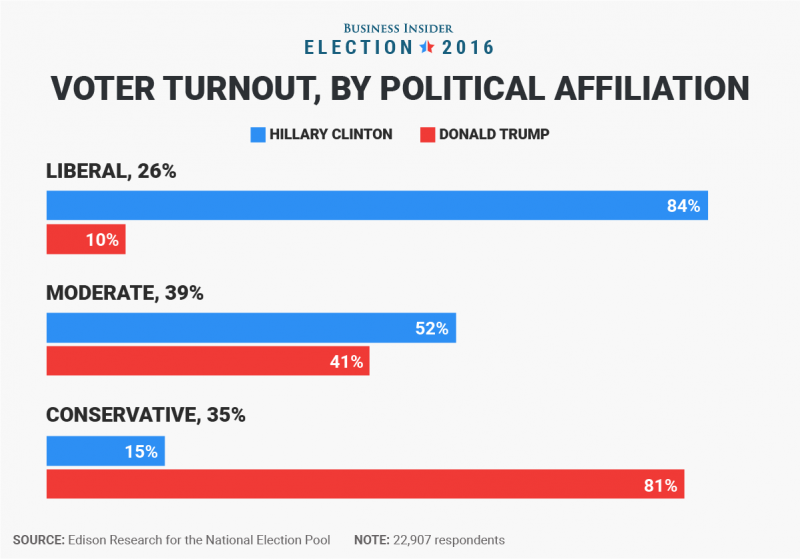
Foto: source Skye Gould/Business Insider
While people living in urban areas predictably voted Democrat, and those in rural areas voted Republican, it’s interesting to see that Trump captured more votes from people living in the suburbs than Clinton did.

Foto: source Skye Gould/Business Insider
While polling before Election Day showed voters with less education were flocking to Trump — which shows in the exit polls — he still saw a good amount of support from voters with higher education.

Foto: source Skye Gould/Business Insider


