
The typical San Francisco household makes about $96,677 each year. That’s nearly double the national median household income of $57,617, according to the US Census Bureau.
A new interactive map – which plots average incomes in counties across the US – visualizes the enormous wealth gap between the San Francisco Bay Area and the rest of the country.
Developed by the mapping-software company Esri, the project explores patterns of wealth and poverty within American cities and the country as a whole.
Take a look at how the Bay Area compares to other metro areas around the US.
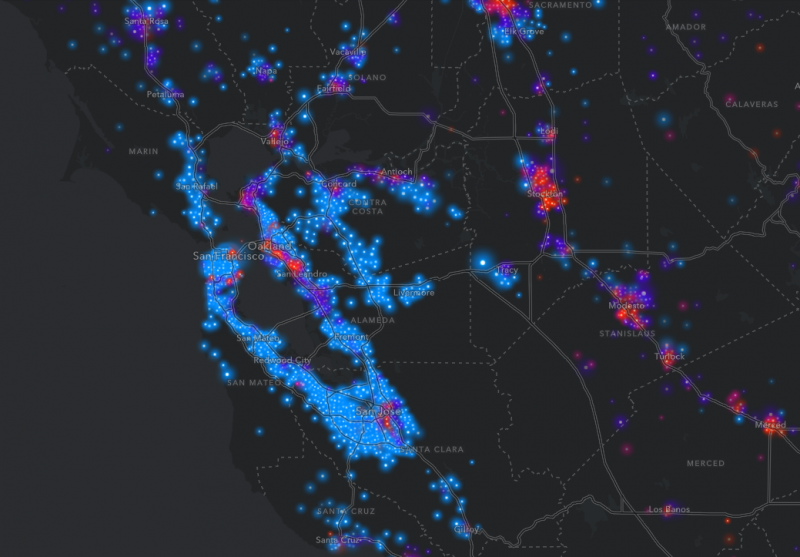
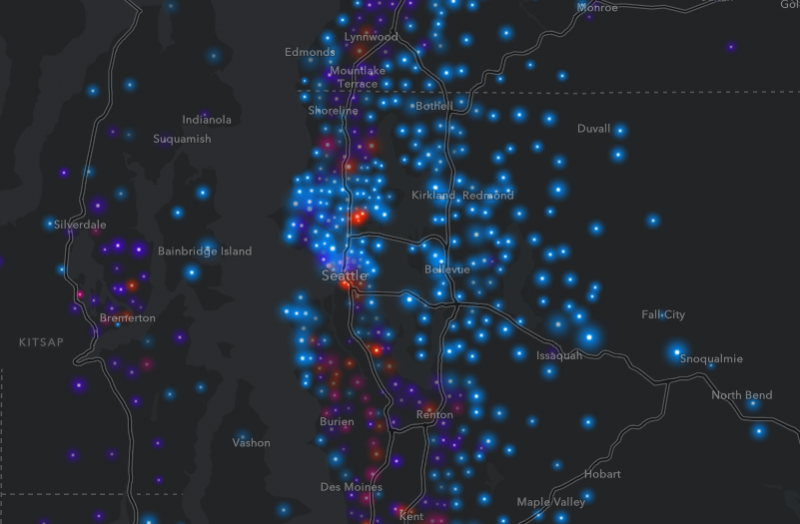
As you can see in the map below, many people in the bright blue urban centers, like Seattle and New York City, make over $100,000.

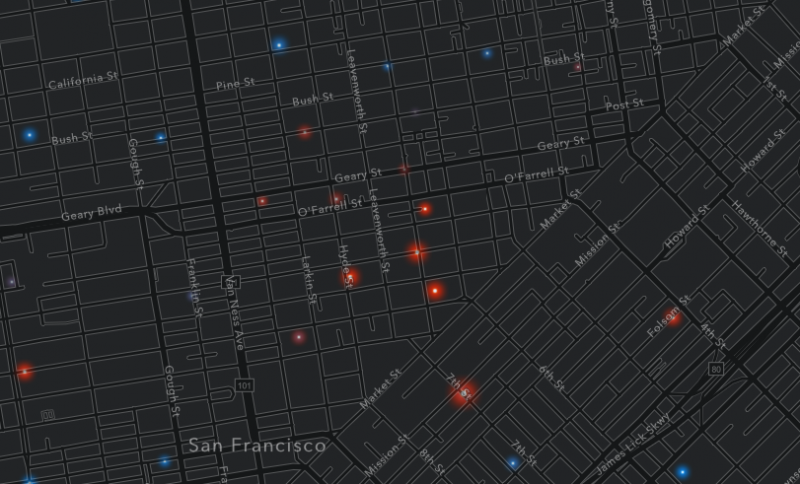
The map indicates income brackets with four different colors.
The blue dots represent areas where the average household makes at least $100,000 per year; purple is $50,000 to $100,000; pink is $25,000 to $50,000; and red is less than $25,000. Larger circles mean more households with a particular salary range.
But the San Francisco Bay Area's blue shines the brightest, meaning there are a lot of households that earn six figures.
Nationwide, about 25% of households earn six figures. Around 22% of households earn less than $25,000 annually.
As a whole, the Bay Area is extremely wealthy. But there are also pockets of poverty throughout.

In Silicon Valley — which features some of the Bay Area's most expensive neighborhoods — the map features many blue dots:.

According to the Silicon Valley Institute for Regional Studies, the median household income in Silicon Valley is around $110,373.
But not all of the Bay Area — or even all of San Francisco — is rich.
As The Mercury News recently reported, some Bay Area households that earn six figures are now considered "low-income" because of how expensive the region has become.
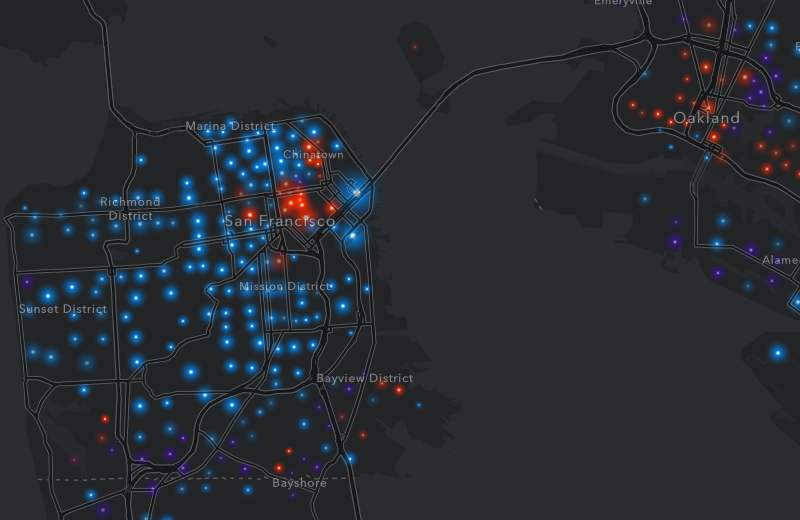
In San Francisco's Tenderloin neighborhood, you will see splotches of red on the map, meaning most households make less than $25,000 annually:
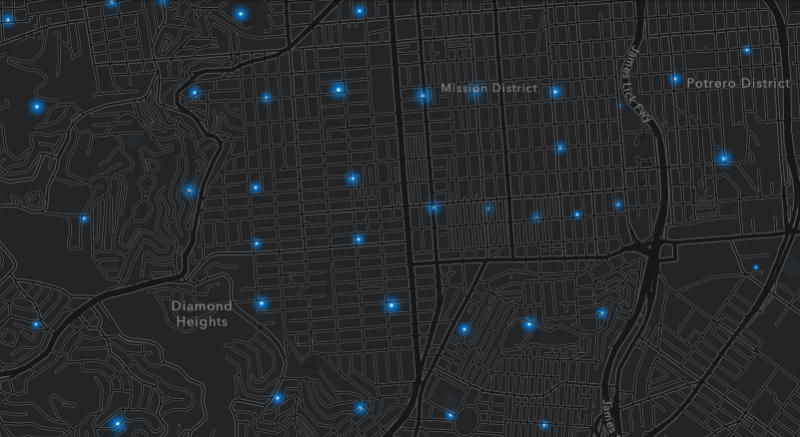
If you go further south, blue covers San Francisco's Mission District neighborhood, where six-figure salaries are common.
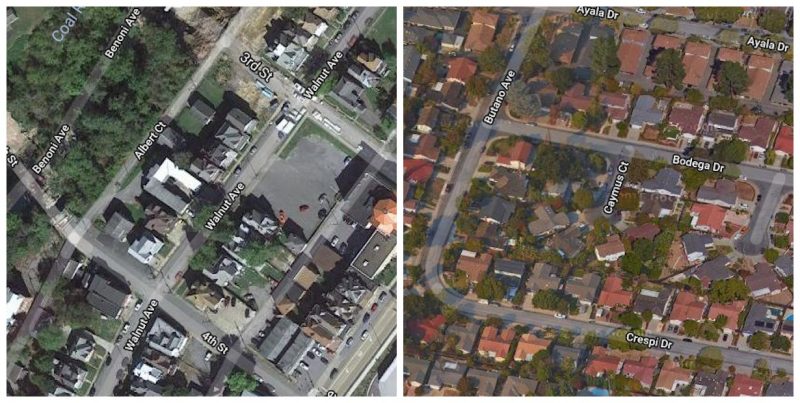
So it's perhaps no surprise that living in the Bay Area at large is unaffordable for many people. The area's housing stock struggles to keep up with demand, contributing to high real-estate prices.

Source: The Guardian
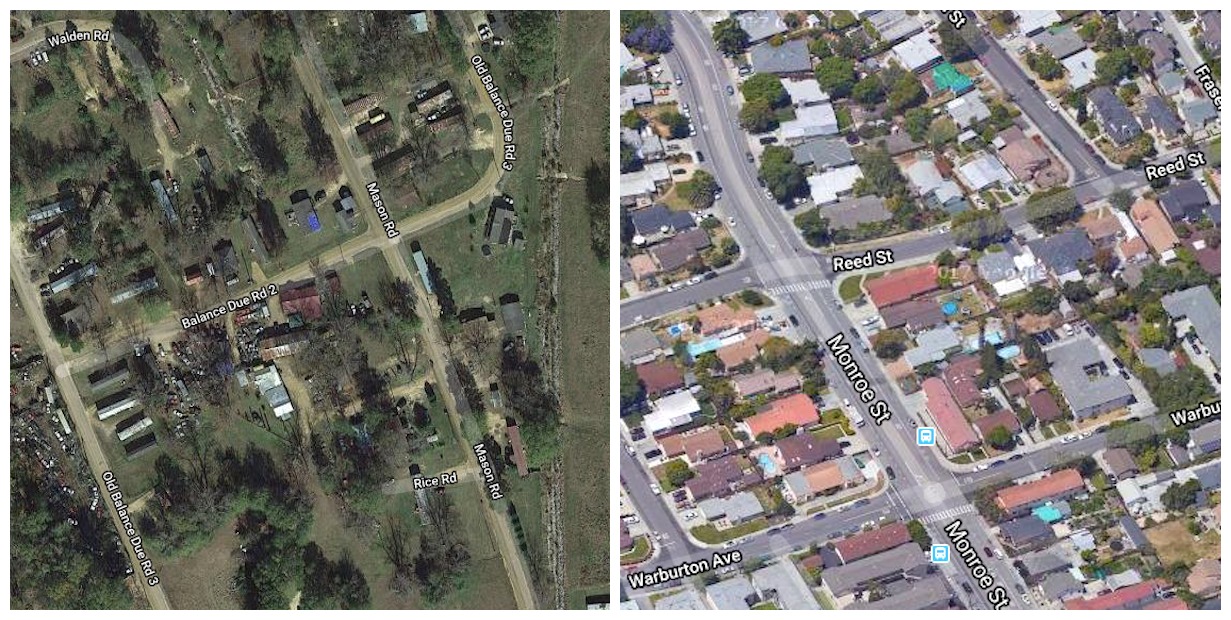
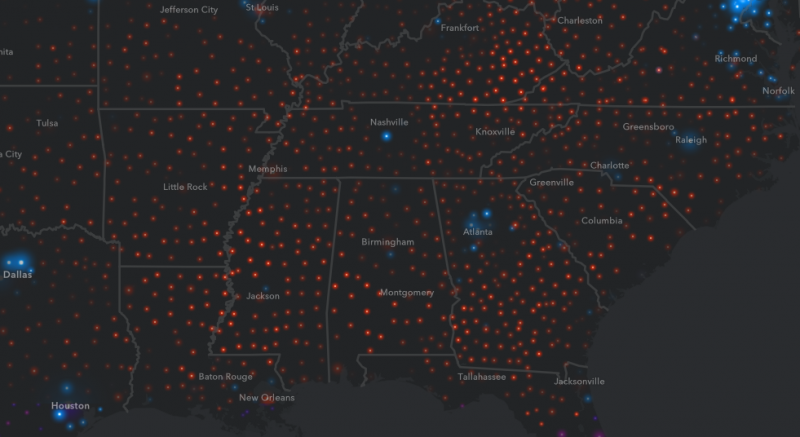
In most other parts of the US, residents make much less. In the majority of Southern counties, over a quarter of households earn less than $25,000.
Households in other parts of the West Coast make between $50,000 to $100,000.

One big reason for this wealth gap is the sheer amount of money that people can earn in the Bay Area. In the past two decades, tech has become one of the nation's fastest growing industries.
As The Verge notes, the country's biggest tech firms - Apple, Alphabet, Facebook, Amazon, and Microsoft - have seen their stock-market share prices reach record highs in recent years.
An increasing number of San Franciscans are also leaving the city. In February, 49% of residents said they would consider leaving California because of high living costs, according to a survey from public-relations firm Edelman.
Source: Business Insider
Economists say that as the American tech industry continues to boom, "new Silicon Valleys" are popping across the US. Seattle, Washington has become one of the nation's fastest growing tech hubs.
Source: USA Today
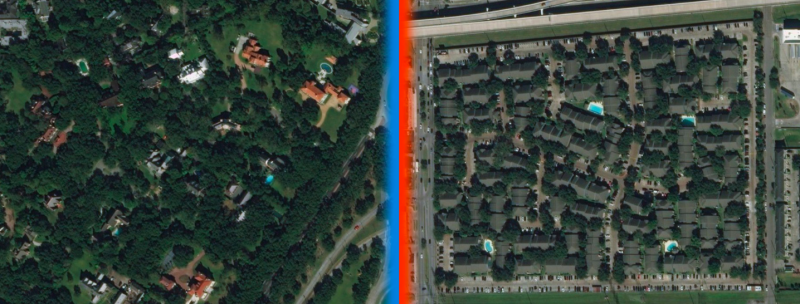
Atlanta, Georgia's tech industry has also seen record growth. The city added thousands of tech jobs in 2017, most of them paying close to six figures. At the same time, Atlanta is much more economically diverse than San Francisco.

Source: The Atlanta Journal-Constitution
Still, the map suggests that a great deal of wealth concentrates in the Bay Area, while other regions of the US — particularly Southern, rural ones — are less affluent and less upwardly mobile.
