- Contrary to popular belief, the stock market and economy have performed better under Democratic presidents than it has under Republican presidents, according to data going back to 1946.
- Liberum, a UK-based investment bank, pointed to historical stock market returns and annual GDP growth to make the case that a Republican president’s drive to cut taxes and reduce government spending often leads to lower economic expansion and stock market returns than when a Democratic president is in office.
- Since 1947, the S&P 500 has posted a total annual return of 10.8% under Democratic presidents, versus 5.6% under Republican presidents.
- And if you exclude the Great Recession and COVID-19 pandemic, both of which happened under a Republican president, the data still points to stronger returns for Democratic presidents versus Republican presidents.
- Visit Business Insider’s homepage for more stories.
It’s a widely held view that Republican presidents are better for the economy and stock market than Democratic presidents, because of their drive to cut taxes and reduce government spending. But the data says otherwise.
According to an August 21 note from Liberum, a UK-based investment bank, historical stock market returns and gross domestic product data points to a stronger economic expansion under Democratic presidents than under Republican presidents.
The firm looked at data going back to 1947, which is when official GDP calculations were introduced, to analyze who did better. Liberum credited a new president with the economic performance of the first quarter of his first year in office.
According to Liberum, the average annual US GDP growth rate under a Democratic president was 3.6%, compared to 2.6% for a Republican president. And those economic gains trickled down to stock market gains as well.
Liberum found that the stock market, represented by the S&P 500, posted an average annual total return of 10.8% under a Democratic president, compared to just 5.6% for a Republican president, since 1947.
Many would likely argue that the data is skewed to favor a Democratic president because it includes the Great Recession of 2008, and the COVID-19 induced market sell-off of 2020, both of which happened under Republican presidents.
Therefore, Liberum also looked at the historical data from 1947 to 2006, which excludes both the Great Recession and the COVID-19 pandemic.
But the data is more of the same. From 1947 to 2006, the average annual return for stocks under a Democratic president was 10.5%, versus 6.1% under a Republican president.
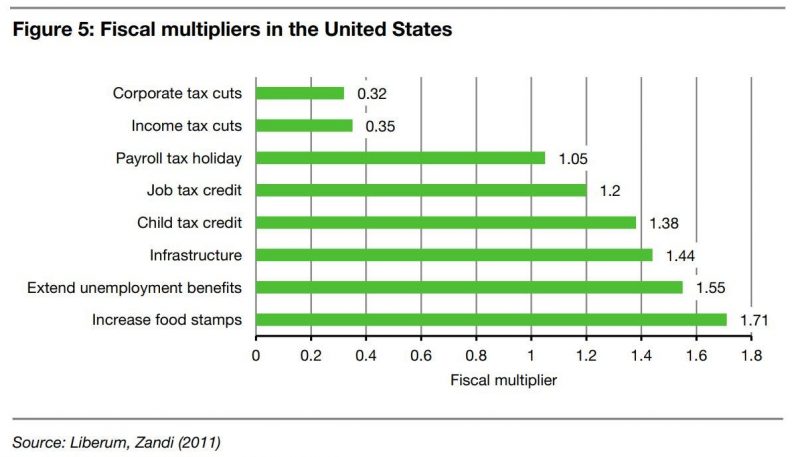
The difference in economic and stock market gains between a Democratic and Republican president can be explained by "fiscal multipliers," according to Liberum.
While Republicans aim to stimulate the economy via tax cuts and deregulation, Democrats aim to stimulate consumption (and thus the economy) with redistribution policies like increased unemployment benefits, increased child credits, and food stamp support, Liberum noted.
And those policy differences can lead to sizable differences in their economic impact.
If a tax cut introduced by Republicans led to a 1% decrease in tax income for the government, it would boost economic growth by 0.3% to 0.4%.
Meanwhile, expanding unemployment benefits and other policies often pushed by Democratic presidents "has a fiscal multiplier of 1.2 to 1.7," Liberum found.
In other words, tax cuts would have to be 5x larger than increases in welfare spending to have a similar economic impact.
"Readers should note that the above is not a political or ideological statement. It as an empirical observation and it holds predominantly in the United States," Liberum concluded.