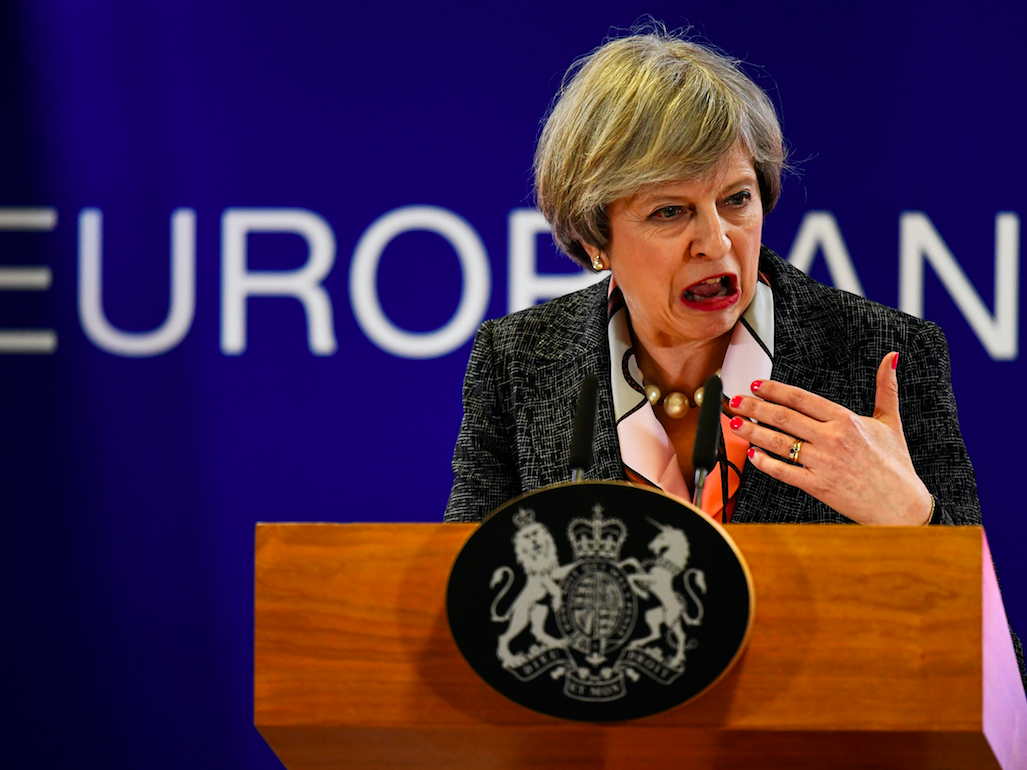
LONDON – Theresa May may have delayed the triggering of Article 50 this week – pushing back the start of the formal Brexit process to the end of the month – but the upcoming event remains in sharp focus for investors across the continent.
Opinions on where the pound will head in the coming months differ wildly among forecasters, with more bearish strategists calling sterling as low as $1.05. Others are a little more optimistic, with Morgan Stanley predicting that it will bounce to levels seen before the referendum before negotiations have finished.
No one can be 100% certain of what happens going forward, especially given the wide array of possibilities once negotiations begin in earnest.
Talks could start on good terms or bad, early bumps – like the UK’s divorce bill – could be ironed out quickly, or take as long as six months (as chief EU negotiator Michel Barnier expects). Thankfully, analysts at Dutch lender ING have produced a handy flow chart, illustrating the likely movements of sterling depending on how talks start.
“In the short-run, we believe the broader risks to GBP continue to lie to the downside, at least until the tail-risk of a ‘messy divorce’ has been taken off the table,” ING’s FX strategist Viraj Patel writes in the bank’s “Brexit begins” note.
"Any initial stalemate in negotiations - and failure to gain clarity on the post-Brexit UK financial and investment climate - will continue to weigh on GBP. The long-run outlook remains a function of the final Brexit deal, with single market access and future of the UK financial sector key factors."
You can see the chart, part of ING's "Brexit begins" note, below:


