
The Federal Reserve just announced, as widely expected, that it intends to hold the benchmark Fed funds rate in a range between 1% and 1.25%. The central bank also gave us some idea about what its policy makers think is coming in the future.
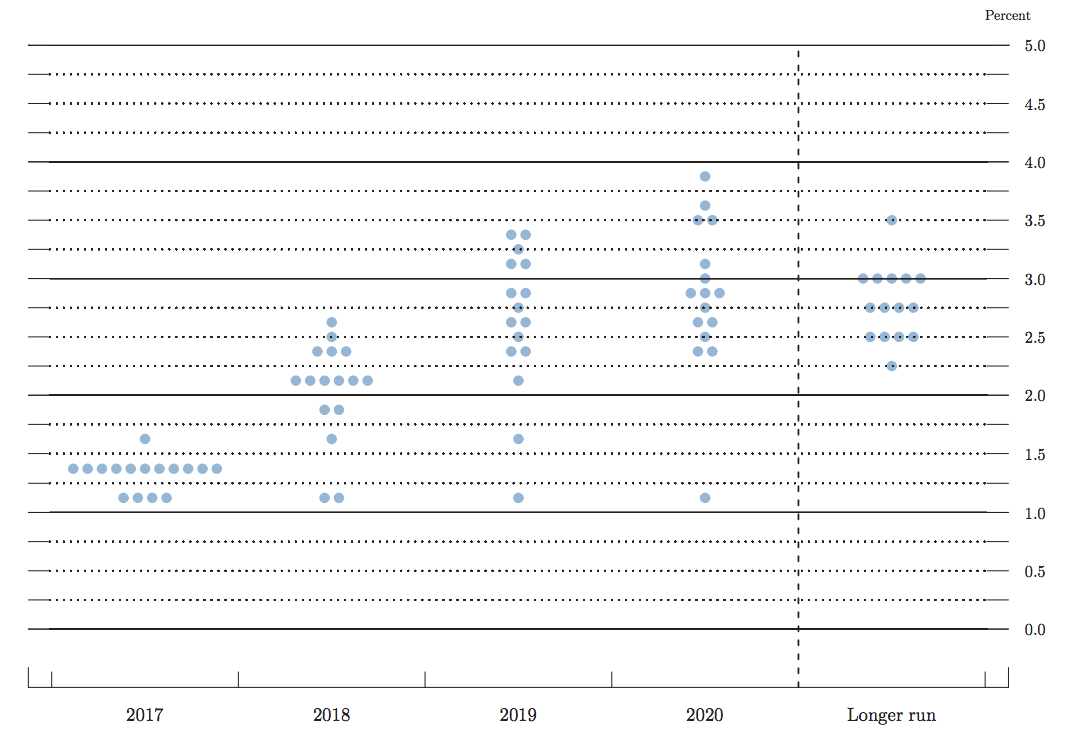
The “dot plot,” part of the FOMC’s Summary of Economic Projections released along with the policy decision statement, shows where each participant in the meeting thinks the Fed funds rate should be at the end of the year for the next few years and in the longer run.
The Fed releases those predictions in a chart that includes a dot for each of the members at their target interest rate level for each time period.
While the “dot plot” is not an official policy tool, it provides some insight into how the committee members feel about economic and monetary conditions going forward. Indeed, several commenters on Wall Street consider the chart to be pretty important, as it could give a sense of how many more hikes are coming this year.
In the plot released after the June meeting, the median FOMC member saw rates rising to between 1.25 and 1.5% by the end of 2017. In the longer term, the Fed expected a gradual schedule of hikes, with rates eventually settling around 3%.
The new dot plot is fairly similar, but slightly more dovish in the long term. The median member again saw the rate ending in a range between 1.25 and 1.5% at the end of 2017, suggesting one more hike this year. In the longer term, the median member expects rates to settle around 2.75%.