
A scourge of fatal drug overdoses, most of them from opioid painkillers like Vicodin and OxyContin, has hit parts of the United States in recent years.
Using data compiled in 1999, 2005, 2014, and 2015, the Centers for Disease Control and Prevention created a series of maps showing how these overdose death rates have shifted across the country.
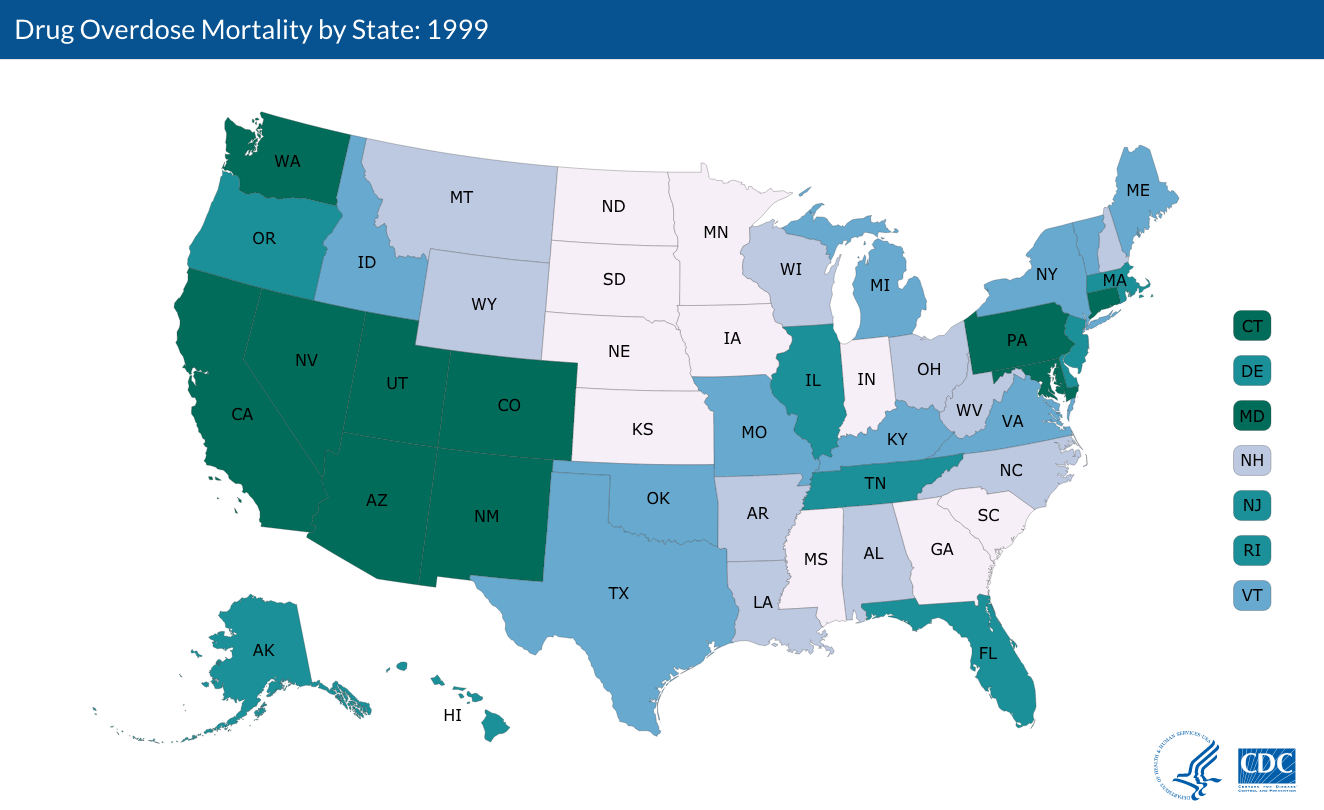
The colors correspond to the number of deaths for every 100,000 people. Dark green indicates the highest rates – a range of 22.2-41.5. Lighter shades represent lower numbers, with the grayish-white indicating a range of 6.9-12. The US average is 16.3.
The CDC’s maps suggest that the trend has moved eastward over the past decade. In 1999, drug overdose rates were highest in western states like California, Arizona, and Washington.
In 2005, central and southern states like Oklahoma and Louisiana had the highest rates.

By 2014 and 2015, eastern states like Ohio, West Virginia, and New Hampshire emerged as hot spots. New Mexico, however, has seen a continuously high rate of overdose deaths throughout the time period studied.


Last year, the CDC released a report listing the 10 drugs most frequently involved in these deaths. They fall into three categories. The first, opioids, includes oxycodone, heroin, morphine, and fentanyl. The second, benzodiazepines, contains drugs like diazepam and alprazolam. The third category is made up of stimulants like cocaine and methamphetamine.
You can check out the CDC's full data set and interactive maps on their website.