
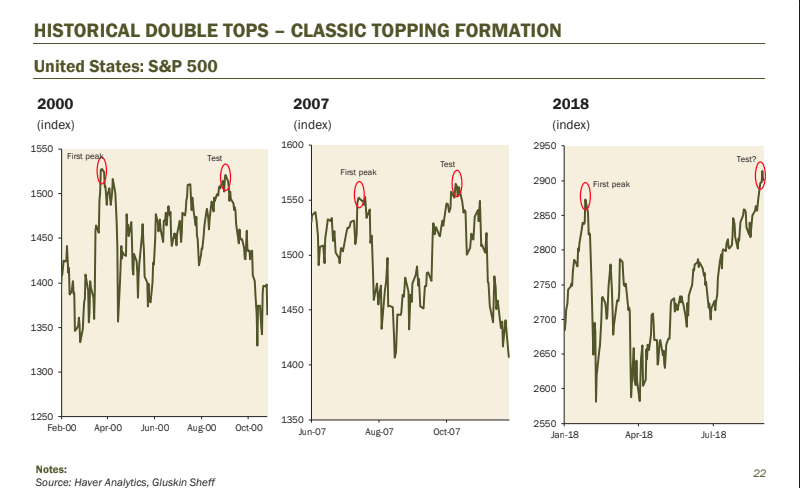
- A potential “double top” is forming in the S&P 500, according to Gluskin Sheff Chief Economist and Strategist David Rosenberg.
- At the same time, volume and stock-market breadth are declining.
- That pattern has shown up in every topping process over the past five decades.
Signs of a stock-market meltdown keep piling up, and now it’s time to add a “classic topping formation” that has shown up in the charts, according to Gluskin Sheff Chief Economist and Strategist David Rosenberg.
In a chartbook sent out to clients on Tuesday, Rosenberg makes note of the “double top” that appears to be taking shape in the S&P 500. Such a formation can occur when there are two consecutive peaks in price, and can signal a trend reversal is about to take place.
“It’s important because every topping process in the market for the past five decades featured a second high that was met with poorer volume and breadth than the first test,” he told Business Insider by email.
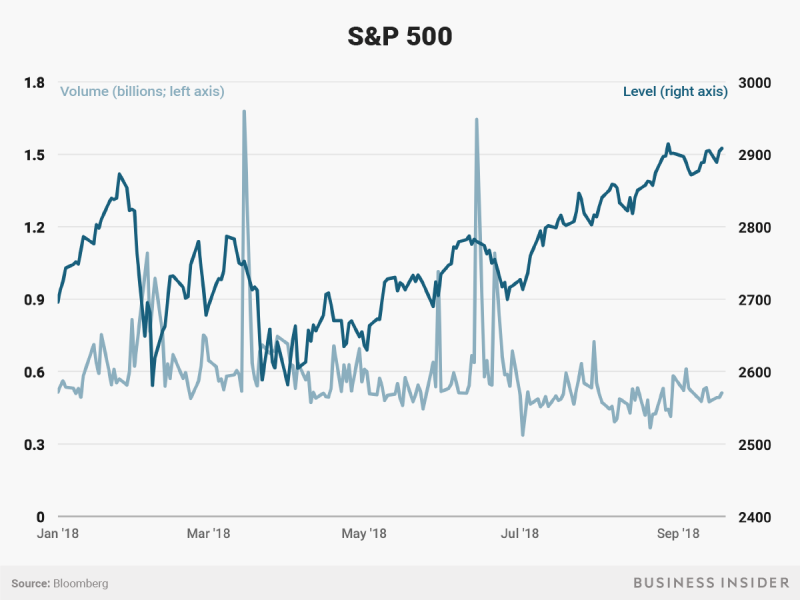
And that is exactly what we see right now. As the chart below shows, S&P 500 volume has tapered off as the benchmark index made new highs at the end of August. This shows traders are buying stocks with less conviction now than they were back in January – in the aftermath of President Donald Trump passing the biggest tax cuts in a generation.
Additionally, stock-market breadth, or the comparison of the number of stocks advancing versus those declining, is also waning, and has Wall Street strategists concerned.
Earlier in September, Bank of America Merrill Lynch's Mike Wilson said that while one key measure of breadth - the share of New York Stock Exchange-listed companies advancing versus those declining - hit a new high in August, a number of other measures are worse. And that's a big part of the reason he has been warning all year that stocks are in a rolling, drawn-out bear market.
"Specifically the % of stocks making new highs, the % of stocks above their 200-day moving average, the performance of equal weighted indices versus their market cap weighted sidekicks at both the broad index level and sector level are all showing signs of deteriorating breadth," Wilson said.
And while a potential "double top" pattern with declining volume and breadth may not on its own be enough to derail the longest bull market in history, it's another checkmark on the list of things traders should be worried about.