
Facebook’s ad business is growing like gangbusters, with marketers forking over big dollars to reach the social network’s vast audience of North American users.
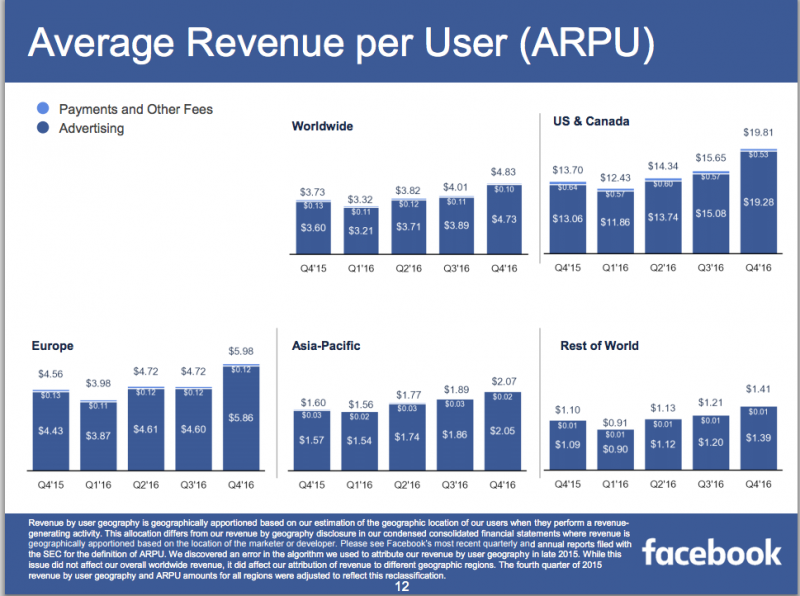
During the fourth quarter, Facebook said that its average revenue per user in the US and Canada swelled to $19.81, up from $13.70 in the final three months of 2015.
Even more impressive, the North American ARPU has exploded in the five years since Facebook had its IPO. In the fourth quarter of 2012, Facebook’s average revenue per user in the US and Canada was just $4.08
Here’s the chart from Facebook’s IPO prospectus back in 2012:
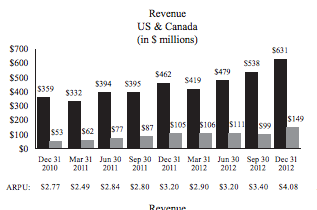
Viewed on an annual basis, Facebook's ARPU story is even more striking. Facebook generated $62.23 per US and Canadian user in 2016, compared to just $13.58 in all of 2012.
In other words, Facebook has figured out how to ring up an additional $50 per year from every North American user since its IPO. Not bad.
What happened?
A lot has changed since Facebook's IPO, particularly Facebook's mobile advertising business, which now accounts for the vast majority of Facebook's revenue (Facebook's payments business contributed just 53 cents of the $19.81 in Q4 North American ARPU).
Back when Facebook made its Wall Street debut, the company's mobile ad business was basically non-existent. After investors freaked out, the company launched a remarkable effort to create a way for markters to reach Facebook users on their smartphones.
Facebook now has 231 million monthly users in the US and Canada, the regions that advertisers are most interested in reaching thanks to the relatively affluent nature of those people.
Facebook's total worldwide revenue also continues to grow, reaching $4.83 in Q4, up more than $1 per user from the year before. For perspective, shortly before Facebook went public in May 2012, its worldwide ARPU was $1.21.
Here's the chart that breaks down how Facebook made its money in recent quarters: