

- New advances in one technical indicator suggest that the S&P 500 is due for a new all-time high, Fundstrat's Tom Lee said.
- The advance/decline line hit an all-time high on Friday. The market breadth indicator leads the S&P 500, he said.
- The index opened just 0.5% from an all-time high on Tuesday.
- Sign up here our daily newsletter, 10 Things Before the Opening Bell.
A technical indicator that measures market breadth is signaling to Fundstrat's Tom Lee that the S&P 500 will soon hit new all-time highs.
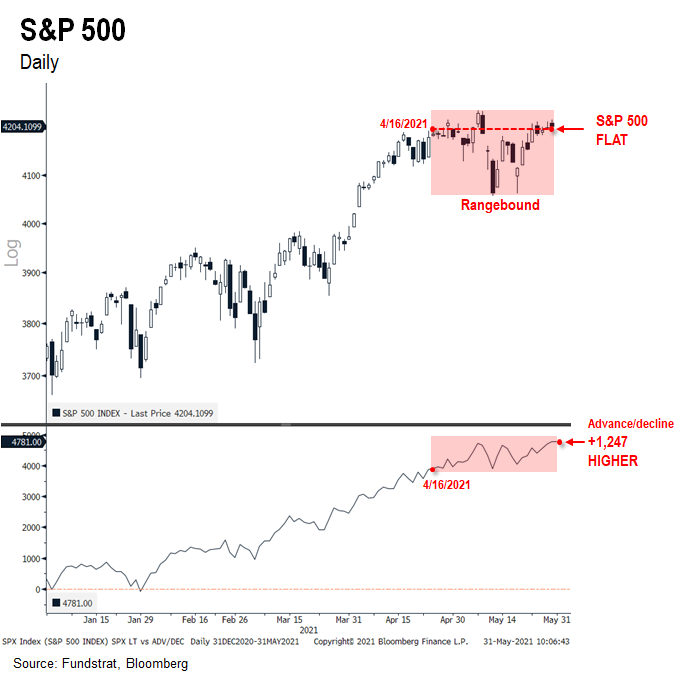
The benchmark index has been "flat" since April 16, as it touched 4,191 that day and closed on Friday at 4,204. However, a technical indicator called the advance decline line gained 1,247 points during the same time period, and hit a new all-time high on Friday.
"Historically, the advance/decline line leads the overall index," said Lee in a Tuesday note."Thus, surging to new ATH on 5/28/2021 presages the overall S&P 500 to advance higher. "
The advance decline line rises when stock advances exceed declines and falls when declines exceed advances. According to Lee, it's showing that market internals are marching to new highs.
He also explained that the S&P 500 may look weaker than the advance decline line suggests because of mega-cap technology stock weakness. Technology stocks are down 4% since April 16.
Lee reiterated Fundstrat's base case forecast that the S&P 500 will reach 4,400 by "mid-2021," a roughly 4% gain from current levels.
The S&P 500 hit an all-time high on May 7 of 4,238.04. On Tuesday morning, the index opened just 0.5% shy of that high.